Vert Global Sustainable Real Estate Fund (VGSRX)
Fund Commentary
December 31, 2022
| For the period ending December 31, 2022 | 1 Month | 3 Month | YTD | 1 Year | 3 Year | 5 Year | Since Inception 10/31/2017 |
|---|---|---|---|---|---|---|---|
| Vert Global Sustainable Real Estate Fund | -4.34% | 7.95% | -26.19% | -26.19% | -4.17% | -0.20% | 0.51% |
| S&P Global REIT Index | -3.52% | 6.88% | -24.36% | -24.36% | -3.33% | 0.92% | 1.67% |
Performance data quoted represents past performance and does not guarantee future results. Investment returns and principal value will fluctuate, and when sold, may be worth more or less than their original cost. Performance current to the most recent month-end may be lower or higher than the performance quoted and can be obtained by calling 1-844-740-VERT. Investment performance reflects fee waivers in effect. In the absence of such waivers, total returns would be reduced. Short term performance, in particular, is not a good indication of the fund’s future performance, and an investment should not be made based solely on returns. Return figures over 1 Year are annualized. The fund Gross Expense Ratio is 0.67%. The fund Net Expense Ratio is 0.50% via expense limitation. Contractual fee waivers through October 31st, 2025. The net expense ratio applies to investors.
Year End 2022 Update
- The Fund celebrated its 5th anniversary and ended the year with $174.4 million in AUM.
- Despite the ‐26.19% return for the year, the Fund enjoyed net new inflows of $52 million.
- The annual Fund Requalification added more holdings to the portfolio.
- In this quarter’s Spotlight we examine “Five Years of Performance for VGSRX”.
Performance
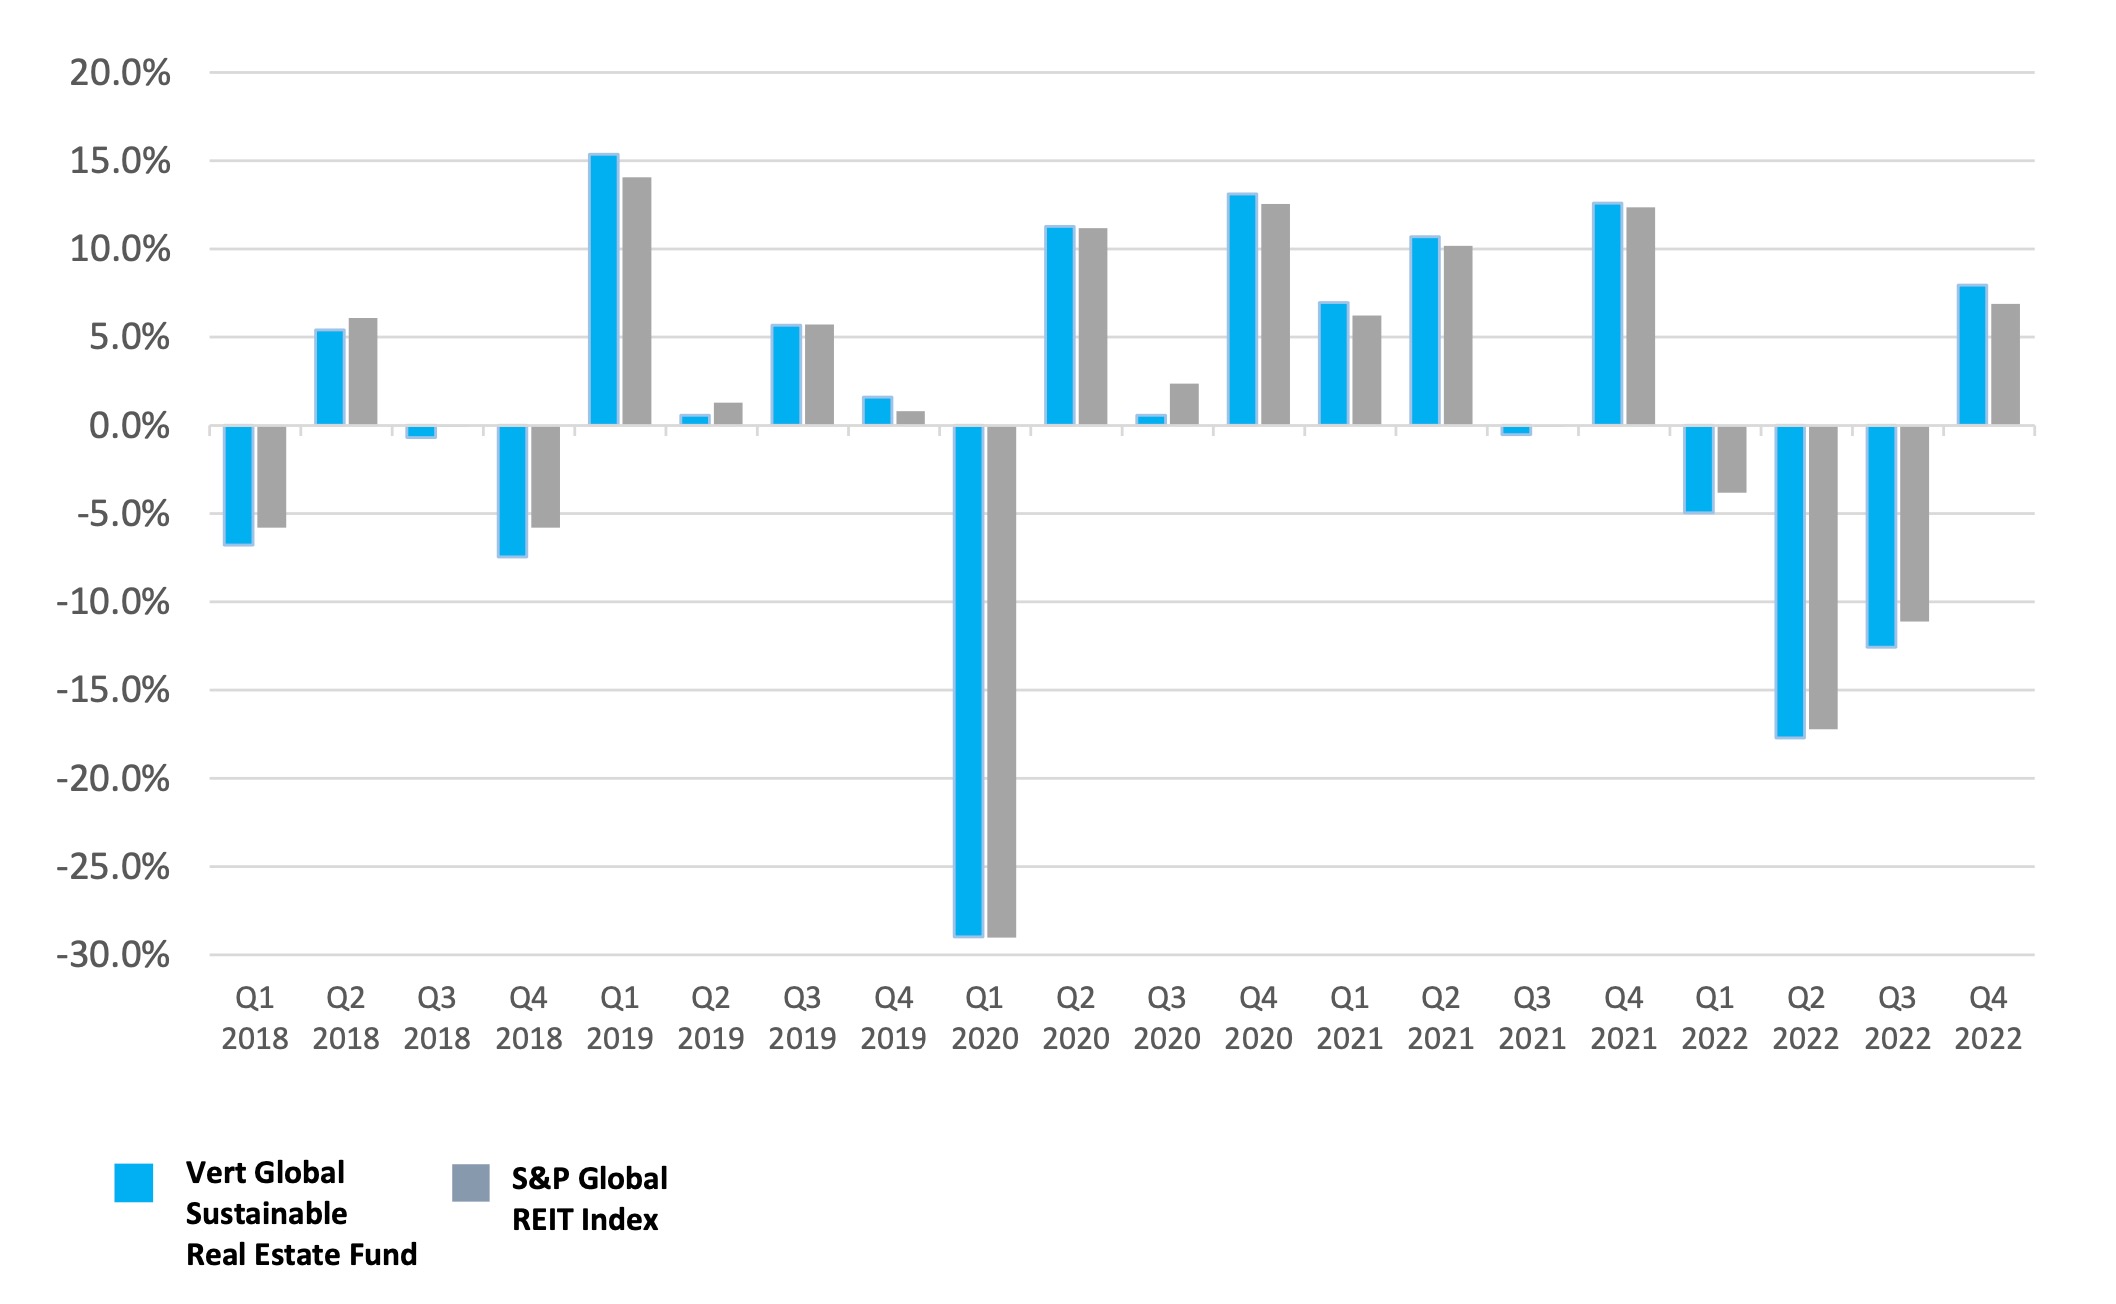
The Real Estate asset class had a horrible year. The 4th quarter was the only quarter to register positive returns, with the fund up 7.95%, but that was only enough to ‘lift’ returns to ‐26.19% for the year. The S&P Global REIT Index came in at ‐24.36% in 2022, earning 2nd place to 2008’s 45% loss in a worst calendar year ever contest.
In the year of Covid, 2020, REITs only dropped about 8%. It seems investors feel that higher inflation and interest rates are a bigger threat to real estate than a pandemic and ensuing shutdown. This is somewhat puzzling. As we’ve discussed in previous commentaries, inflation (see Sept. 2021) and rising interest rates (see March 2022) have historically been associated with REIT outperformance compared to other asset classes. Rather than fall prey to the classic investor error of ‘it’s different this time’, we’ll wait and see how it all shakes out.
The Fund reached its five‐year anniversary on October 31st, 2022. With this milestone achieved, we take a closer look at the performance of the fund since inception in this quarter’s Spotlight, below.
AUM and Fund Flows
Portfolio Re-Qualification
At the end of each year, our Investment Research Group re-qualifies the entire portfolio. The re-qualification process leads to a rebalancing of the portfolio to the most sustainable REITs based on the latest data. This year the re-qualification process identified 17 new REITs to add to the portfolio based on their leadership on environmental, social, and governance (ESG) criteria. We also determined that 8 existing holdings no longer made the grade. The fund will hold 143 companies to start 2023.
The overall portfolio characteristics have not changed much due to the re-qualification. Despite holding less than one-third the number of companies in the benchmark S&P Global REIT Index, the fund displays similar valuation and profitability characteristics. The fund does have a moderate large cap bias, as many ESG funds do as a result of better sustainability reporting from larger companies.
Last year the fund parted ways with the only Hong Kong holding. The fund has no direct exposure to China, Hong Kong or Taiwan. Similarly, the fund has no direct exposure to Russia, Ukraine, or any eastern European country. We added Italy for the first time by qualifying a new Italian company in this re-qualification, bringing the country count to 14.
Spotlight on the Five Year Performance Review for VGSRX
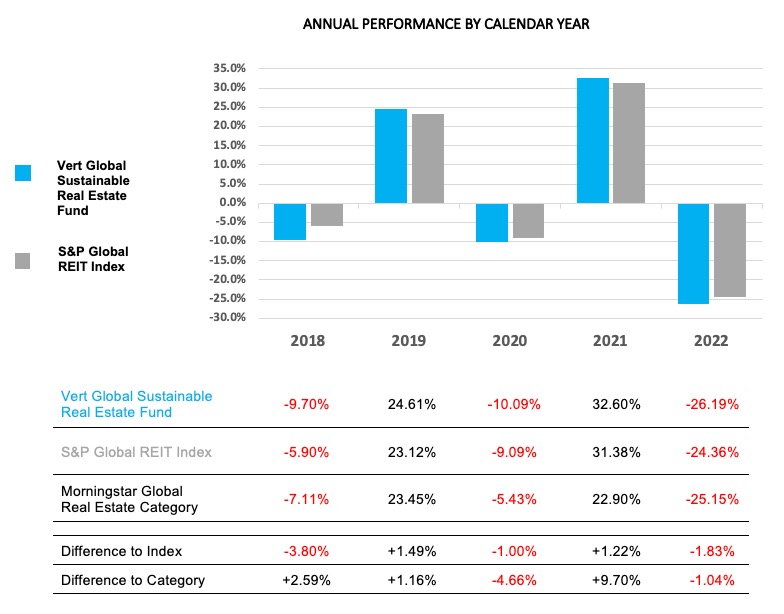
The Vert Global Sustainable Real Estate Fund now has five years of live performance. Since inception the fund has an annualized return of 0.51%, thus underperforming its benchmark, the S&P Global REIT Index, which returned 1.67%. The charts below compare the calendar year returns with the benchmark and the Morningstar category. It is clear that the underperformance came in the three negative years, and much of it in 2018. The fund outperformed in the two positive years, 2019 and 2021.
In this Spotlight we look into the reasons for the differences in performance between fund and index.
The Fund's Strategy
The fund seeks to achieve sustainable investors’ twin goals of sustainability and market rates of return. We are gratified that the fund has accomplished both objectives. As you can see from the quarterly and annual chart the fund moved with the index reliably through time, but with some tracking error.
We fully expect performance to deviate from the benchmark when we hold only about a third of the stocks in the index. Keeping tracking error below 3% while investing in what we believe are the sustainability leaders demonstrated that our strategy is working as intended.
Identifying the Sources of Relative Performance
The first question investors often ask about ESG is what impact it has on performance. ESG can impact fund performance but in most cases, other fundamental characteristics play a larger role. Performance is often determined by systemic differences created through asset allocation, country and sector weights, and factor exposures (i.e. size, valuation, profitability). The way we seek to deliver returns closer to the benchmark is to keep these fundamental characteristics similar, and that is exactly how we run the strategy.
Similarities between VGSRX and the index:
- Investable Universe – both fully invested in Global Equity REITs
- Country Weights – very similar
- Sector Weights – very similar
- Factor Tilts -similar except for a large cap bias for VGSRX
Differences between VGSRX and the index:
- Sustainability Tilt – the index has no tilt while VGSRX has a strong tilt
- Number of Holdings – the index holds over 400 companies while VGSRX holds less than 150.
- Expense Ratio – the index has no fees while VGSRX has a net expense ratio of 0.50%.
The fund’s underperformance since inception of 1.16% comes partly from fees. The gross expense ratio of the fund is 0.67%, but we have limited the net expense ratio of the fund to 0.50%, so the remaining underperformance to examine is 0.66%. We believe this was caused by idiosyncratic variation due to fewer holdings. This variation was most pronounced in 2018, and less so in the following years.
2018
The fund’s first calendar year was its worst year on a relative basis, underperforming by 3.8%. The poor performance can largely be attributed to holding just 98 stocks that year, being underweight in Japan, and underweight Self-Storage REITs. After 2018, we made adjustments to reduce future tracking error.
- Increased holdings to over 120 by expanding the starting universe:
- Refined our country and sector weightings by identifying ESG leaders within peer groups rather than across the globe.
• Added 4 new countries, and added REITs from more sub-sectors like Self Storage.
• Reduced the minimum market cap from $1 billion to $500 million.
With these adjustments we increased the diversification of the portfolio without reducing the tilt to sustainability. Since these changes, performance in the last 4 years has been within 2% of the benchmark each year.
3 Down Years and 2 Up Years
With less holdings, the fund has more variable performance than the index. This is evident statistically: VGSRX had a standard deviation of 20.51% versus 19.69% for the index. The beta of the fund relative to the index was 1.04. Tracking error was 2.29.
This is also clear visually: see the above charts on annual performance. The fund has underperformed in down years and outperformed in up years. Unfortunately, we’ve seen three down years and two up years so far. We are confident that over the longer term, markets go up more often than they go down. This might bode well for the fund’s relative performance going forward.
The Dispersion of REIT Performance
The five-year average return for REITs of about 1% masks a lot of volatility. It also obscures that there were distinct sub-sector winners and losers within the real estate asset class. Below we summarize some of these differences and how they contributed to or detracted from the relative performance of VGSRX. We don’t believe these performance stories will necessarily repeat themselves, in fact, some might revert to the mean. The stories do highlight the high degree of variation in experience different types of REITs have in different market conditions.
Tower REITs are infrastructure companies that own cell phone towers and other equipment that they rent primarily to wireless communications companies. The last five years was a boom time for these stocks, as our lives continued to shift more online, accelerated of course by the Covid-19 crisis. The S&P Global REIT Index doesn’t include any Tower REITs in it, but some funds and indices do. In fact, the three Tower REITs are all large caps, so some funds hold well over 10% across these three stocks. VGSRX holds one tower REIT, American Tower, but did not hold it yet in 2018. We also limit individual holdings to 5%, so our exposure to Towers is limited.
Holding American Tower benefited the fund versus the S&P Global REIT Index, but being underweight Towers detracted from our performance relative to some funds and indices.
Self-Storage REITs have had a good five year run. The space is dominated by two large companies, Public Storage and Extra Space Storage. You might recognize them as they are frequently located near freeways and have colorful signage – Public in bright orange and Extra Space in green. Extra Space is green indeed, having won awards for their sustainability commitments but also for posting greater than 100% return over the past five years. Public Storage, a top ten holding in the index, has also done well, up over 50%, but hasn’t a strong enough commitment to sustainability to be included in the fund. The Fund holds Extra Space but not Public. We did not add Extra Space until 2019 however.
Being underweight storage REITs has hurt the performance of the fund relative to the benchmark.
Single Family Residential REITs are a relatively new form of residential REITs that hold thousands of, you guessed it, single family homes. While the concept is sound, the execution of the business model to date, as far as we can tell, has been problematic. The two largest SFR REITs have been accused of charging exorbitant fees, delaying or denying maintenance requests, and even displacing residents. These two REITs have enjoyed +50% returns over the past five years, but we have no problem continuing to disqualify them. We prefer to hold residential landlords that treat tenants better – see the manufactured home REITs below for example.
Not holding the SFR REITs detracted from our relative performance over the past five years.
Manufactured Housing is the modern term for what we used to call mobile homes. The units are built in a factory for cost and quality control and then installed in an affordable community. They are an important part of the affordable and workforce housing supply in the US. VGSRX qualifies 3 of these REITS for providing affordable housing as a mission. These three REITs have averaged over 100% return since inception of the fund.
We hold these three REITs in market cap weights, but since we hold fewer companies overall than the index, we are overweight them relative to the index. This overweighting helped the fund’s performance.
Mall REITs suffered greatly during Covid. The ones that VGSRX hold tend to be Class A malls, which are defined by prime location and include higher quality retail tenants. These REITs had ample financial resources, recovered more quickly, and most importantly, survived. The malls you saw closing where most likely Class B and C malls. The fund managed to avoid the three mall REITs that went bankrupt due to the pandemic.
Not holding lower quality mall REITs, and in particular the three in bankruptcy, helped the fund’s performance.
Prison REITs were profiled in our first ever ‘Spotlight’, written in late 2019. In that piece, we detailed why we don’t invest in these firms and in fact we have excluded both of the two prison REITs from the start. Neither are REITs anymore – after their stock value dropped by over 50% they both abandoned the REIT structure altogether. We won’t miss them. Prison REITs were the worst performing type of REIT since their arrival in 2013.
The fund benefited by not ever holding the prison REITs.
China introduced the REIT structure in June of 2021. We avoided investing in the 9 REITs listed at that time, and still disqualify all 24 that now have REIT status in China. We are not confident enough in China’s application of property rights and the rule of law to invest. Chinese real estate has now suffered through two consecutive years of losses greater than 25%.
Omitting China has helped the fund’s overall performance. The S&P Global REIT Index has had only a small weight in China, so not holding Chinese REITs has only benefited the fund by a small amount relative to the index.
DOWNLOAD
Explore more commentaries.
Fund holdings and/or sector allocations are subject to change at any time and are not recommendations to buy or sell any security. Current and future holdings are subject to change.
Please refer to the Prospectus for full risk disclosures. All data as of December 31, 2022 and subject to change daily.
The Vert Global Sustainable Real Estate Fund’s investment objectives, risks, charges, and expenses must be considered carefully before investing. The statutory, and if available summary prospectuses contain this and other important information about the investment company, and may be obtained by calling 1-844-740-VERT or visiting www.vertasset.com. Read carefully before investing.
Mutual fund investments involve risk. Principal loss is possible. Investors should be aware of the risks involved with investing in a fund concentrating in REITs and real estate securities, such as declines in the value of real estate and increased susceptibility to adverse economic or regulatory developments. Investments in foreign securities involve political, economic and currency risks, greater volatility and differences in accounting methods. A REIT’s share price may decline because of adverse developments affecting the real estate industry. REITs may be subject to special tax rules and may not qualify for favorable federal tax treatment which could have adverse tax consequences. The Fund’s focus on sustainability may limit the number of investment opportunities available to the fund and at time the fund may underperform funds that are not subject to similar investment considerations. Diversification does not assure a profit or protect against loss in a declining market.
The Fund’s focus on sustainability considerations (environmental, social, and governance or ESG criteria) may limit the number of investment opportunities available to the Fund, and as a result, at times, the Fund may perform differently from funds that are not subject to similar investment considerations.
The manager Vert Asset Management has contractually agreed to limit the expense ratio to 0.50% through 10/31/25. Net expense ratio is what the investor would pay. The gross expense ratio was 0.67% as of 10/31/22.
The S&P Global REIT Index is drawn from constituents in the S&P Global Property Index. Constituents must conform to the legal structures that define a real estate investment trust in the U.S., or similar guidelines in the country of their domicile. The REITs in the index are primarily companies that invest in buildings, which are human occupied or used for storage. The REIT indices specifically exclude timber REITs, mortgage REITs and mortgage-backed REITs. One cannot invest directly in an index.
Beta is a concept that measures the expected move in a stock relative to movements in the overall market. A beta greater than 1.0 suggests that the stock is more volatile than the broader market, and a beta less than 1.0 indicates a stock with lower volatility.
Environmental, social, and governance (ESG) criteria refer to activities that contribute to the business that are not quantified in typical financial reporting.
Market rate of return is the most recent return of the market index appropriate for the asset class in reference.
Standard deviation is a measure of volatility regarding investment returns.
Tracking error is the divergence between the price behavior of a position or a portfolio and the price behavior of a benchmark.
The Vert Global Sustainable Real Estate Fund is distributed by Quasar Distributors, LLC.